5. Real-World Examples of AR in Environmental or Biorelated Fields
5.1. AR for In-Situ Environmental Monitoring and Data Visualization
Environmental monitoring at field sites typically involves deploying sensors, collecting samples, and conducting off-site analysis, methods that often delay response time and limit spatial context. In the case of microbial bioremediation, this becomes especially problematic, as microbial activity, redox conditions, or contaminant concentration gradients are largely invisible and highly dynamic. Augmented Reality (AR) addresses these issues by enabling real-time, spatially anchored visualization of field data, allowing scientists to interact with environmental information in the very place it is most relevant (Wang et al., 2022; Pokrić et al., 2012).
AR systems can fuse:
- · Environmental sensor data (e.g., pH, dissolved oxygen, temperature),
- · GIS-based site layouts (e.g., pollutant source zones),
- · Predictive models (e.g., COMSOL/MODFLOW),
- · Microbial activity patterns (e.g., eDNA-based abundance or gene expression profiles).
This allows researchers, environmental engineers, or site managers to "see" chemical and biological processes overlaid in the actual field, facilitating timely and evidence-based interventions (Zhang et al., 2023).
In microbial remediation projects, AR can:
- · Display real-time concentrations of contaminants like uranium, hydrocarbons, or nitrates directly on a field surface;
- · Overlay microbial colonization zones (based on qPCR, eDNA, or omics data) on physical sampling locations;
- · Show bioavailability zones, where pollutants are accessible or inaccessible to microbial degradation based on soil porosity or binding state (Guo et al., 2023);
- · Visually represent injection well influence, e.g., showing how acetate spreads underground to stimulate Geobacter populations (Lovley et al., 2003; Zhang et al., 2023).
These applications shift bioremediation monitoring from reactive to proactive: potential failures can be identified early, and scientists gain a real-time map of microbial activity and pollutant behavior.
ekoNET: AR-Enabled Environmental Monitoring Platform
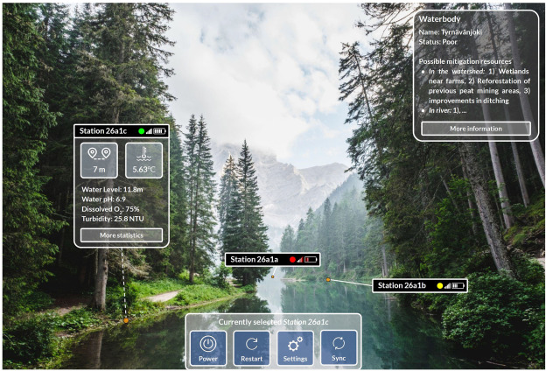
Developed as an IoT-based pollution tracking system, ekoNET integrates mobile AR with environmental sensors to visualize real-time air and water quality on-site (Pokrić et al., 2012). Users scan the environment using mobile devices to view levels of pollutants such as CO₂, NO₂, and turbidity.
Implications for Bioremediation: In microbial field trials, a similar setup could be configured to display maps of:
- · Subsurface contaminant plumes,
- · Nutrient diffusion zones,
- · Reactive barriers enhanced with microbial consortia.
Zhang et al. (2023) developed an AR tool for visualizing groundwater flow, pollutant dispersion, and remediation infrastructure using georeferenced 3D models. This system allowed users to understand the spatial relationships between contaminant sources, clean zones, and microbial activity zones in real-world industrial sites.
Application to Field Testing: AR could assist in microbial remediation pilot sites by showing how pollutant concentrations change spatially after microbial inoculation or nutrient injection, directly on-site, without needing to consult GIS platforms or wait for lab results.
AR has growing potential to support multi-omics-based field interpretation. Wang et al. (2022) demonstrated AR integration with metagenomics, allowing users to overlay functional gene expression (e.g., cydA, alkB, narG) onto specific GPS-tagged sites, producing spatial views of microbial functions.
Relevance to Microbial Field Trials:
- · Field teams could visualize microbial activity linked to pollutant degradation in real time.
- · Omics data could be used to verify whether microbes are actively reducing contaminants or merely surviving.
Simulation tools like COMSOL or MODFLOW can be used to forecast nutrient dispersion or microbial transport. When paired with AR, these models can project expected outcomes directly onto the site, aiding the planning of injection schemes and monitoring stations (Silva & Gültekin, 2021).
Benefits in Bioremediation Practice
1. Real-time Decision-Making
By combining on-site visualizations with live data, field teams can adjust bioremediation strategies quickly (e.g., shift nutrient injection, change sampling plans).
2. Improved Spatial Awareness
Visualizing chemical gradients or microbial abundance zones directly in the field helps target remediation more accurately.
3. Enhanced Communication
Stakeholders (e.g., landowners, regulators) can better understand invisible processes, building trust and enabling clearer risk communication.
4. Safety and Containment Monitoring
AR can flag zones where microbial overgrowth or secondary pollutants may emerge, supporting biosafety in cases involving genetically engineered organisms (Schmidt et al., 2021).